Térinformatikai vizualizáció Geopandas segítségével#
%matplotlib inline
Bevezetés a Shapely könyvtárba#
!pip install shapely
Requirement already satisfied: shapely in /home/zoltan/env/uni/lib/python3.8/site-packages (1.8.5.post1)
Pontok (Point)#
#from shapely import Point
from shapely.geometry import Point
point = Point((10.0, 20.0))
point

print(point.coords)
print(list(point.coords))
print(point.x, point.y)
print(point.coords[:])
<shapely.coords.CoordinateSequence object at 0x7f1c77386df0>
[(10.0, 20.0)]
10.0 20.0
[(10.0, 20.0)]
print('length = ', point.length)
print('area = ', point.area)
length =  0.0
area =  0.0
Vonalak (LineString) és műveleteik#
from shapely.geometry import LineString
north_high_street = LineString([(5, 0), (5, 10)])
north_high_street

print(north_high_street.coords)
print(list(north_high_street.coords))
print(north_high_street.coords[:])
<shapely.coords.CoordinateSequence object at 0x7f1c77386df0>
[(5.0, 0.0), (5.0, 10.0)]
[(5.0, 0.0), (5.0, 10.0)]
print('length = ', north_high_street.length)
print('area = ', north_high_street.area)
length =  10.0
area =  0.0
p1 = Point((0, 6))
p2 = Point((20, 6))
fifth_street = LineString([p1, p2])
fifth_street

cross_fifth_and_high = fifth_street.intersection(north_high_street)
cross_fifth_and_high

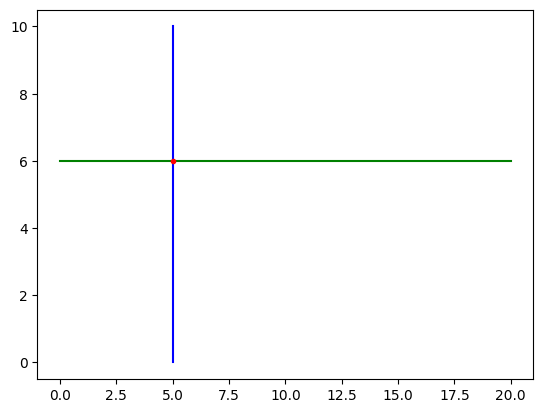
import matplotlib.pyplot as plt
plt.plot(*north_high_street.xy, 'b')
plt.plot(*fifth_street.xy, 'g')
plt.plot(*cross_fifth_and_high.xy, 'r.')
[<matplotlib.lines.Line2D at 0x7f1c770d5af0>]
print(north_high_street.contains(cross_fifth_and_high))
print(fifth_street.contains(cross_fifth_and_high))
True
True
Poligonok (Poligon) és műveleteik#
from shapely.geometry import Polygon
district = Polygon([(2.5, 2), (0, 8), (10, 8), (10, 2)])
district

print('length = ', district.length)
print('area = ', district.area)
length =  30.0
area =  52.5
Bevezetés a Geopandas könyvtárba#
!pip install --upgrade geopandas
import geopandas
import fiona
Requirement already up-to-date: geopandas in /home/zoltan/env/uni/lib/python3.8/site-packages (0.13.2)
Requirement already satisfied, skipping upgrade: shapely>=1.7.1 in /home/zoltan/env/uni/lib/python3.8/site-packages (from geopandas) (1.8.5.post1)
Requirement already satisfied, skipping upgrade: pandas>=1.1.0 in /home/zoltan/env/uni/lib/python3.8/site-packages (from geopandas) (2.0.2)
Requirement already satisfied, skipping upgrade: fiona>=1.8.19 in /home/zoltan/env/uni/lib/python3.8/site-packages (from geopandas) (1.9.4.post1)
Requirement already satisfied, skipping upgrade: pyproj>=3.0.1 in /home/zoltan/env/uni/lib/python3.8/site-packages (from geopandas) (3.5.0)
Requirement already satisfied, skipping upgrade: packaging in /home/zoltan/env/uni/lib/python3.8/site-packages (from geopandas) (23.1)
Requirement already satisfied, skipping upgrade: python-dateutil>=2.8.2 in /home/zoltan/env/uni/lib/python3.8/site-packages (from pandas>=1.1.0->geopandas) (2.8.2)
Requirement already satisfied, skipping upgrade: pytz>=2020.1 in /home/zoltan/env/uni/lib/python3.8/site-packages (from pandas>=1.1.0->geopandas) (2023.3)
Requirement already satisfied, skipping upgrade: tzdata>=2022.1 in /home/zoltan/env/uni/lib/python3.8/site-packages (from pandas>=1.1.0->geopandas) (2023.3)
Requirement already satisfied, skipping upgrade: numpy>=1.20.3; python_version < "3.10" in /home/zoltan/env/uni/lib/python3.8/site-packages (from pandas>=1.1.0->geopandas) (1.24.3)
Requirement already satisfied, skipping upgrade: certifi in /home/zoltan/env/uni/lib/python3.8/site-packages (from fiona>=1.8.19->geopandas) (2023.5.7)
Requirement already satisfied, skipping upgrade: click~=8.0 in /home/zoltan/env/uni/lib/python3.8/site-packages (from fiona>=1.8.19->geopandas) (8.1.3)
Requirement already satisfied, skipping upgrade: cligj>=0.5 in /home/zoltan/env/uni/lib/python3.8/site-packages (from fiona>=1.8.19->geopandas) (0.7.2)
Requirement already satisfied, skipping upgrade: attrs>=19.2.0 in /home/zoltan/env/uni/lib/python3.8/site-packages (from fiona>=1.8.19->geopandas) (23.1.0)
Requirement already satisfied, skipping upgrade: click-plugins>=1.0 in /home/zoltan/env/uni/lib/python3.8/site-packages (from fiona>=1.8.19->geopandas) (1.1.1)
Requirement already satisfied, skipping upgrade: six in /home/zoltan/env/uni/lib/python3.8/site-packages (from fiona>=1.8.19->geopandas) (1.16.0)
Requirement already satisfied, skipping upgrade: importlib-metadata; python_version < "3.10" in /home/zoltan/env/uni/lib/python3.8/site-packages (from fiona>=1.8.19->geopandas) (6.6.0)
Requirement already satisfied, skipping upgrade: zipp>=0.5 in /home/zoltan/env/uni/lib/python3.8/site-packages (from importlib-metadata; python_version < "3.10"->fiona>=1.8.19->geopandas) (3.15.0)
Adatbetöltés#
Térbeli adatot tartalmazó fájlok felhasználás szerinti csoportosítása:
CAD-célú: DWG, DXF, DGN
GIS-célú: SHP, GPKG, MapInfo File, SQLite, DAT
Hobby-rekreációs: GPX, KML
Téradat fájl formátumok osztályozása az adat tárolásának módja szerint:
Bináris fájl: SHP, GPKG, MapInfo File
Szöveges fájl: GeoJson, KML, GPX, DAT
Téradatbázis: SQLite
TODO
import fiona
fiona.supported_drivers
{'DXF': 'rw',
 'CSV': 'raw',
 'OpenFileGDB': 'raw',
 'ESRIJSON': 'r',
 'ESRI Shapefile': 'raw',
 'FlatGeobuf': 'raw',
 'GeoJSON': 'raw',
 'GeoJSONSeq': 'raw',
 'GPKG': 'raw',
 'GML': 'rw',
 'OGR_GMT': 'rw',
 'GPX': 'rw',
 'MapInfo File': 'raw',
 'DGN': 'raw',
 'S57': 'r',
 'SQLite': 'raw',
 'TopoJSON': 'r'}
Töltsük le, majd kicsomagolás után töltsük be a Világtérkép adatokat.
world_borders = geopandas.read_file("data/geo_viz/world_borders.shp")
Támogatott formátumok a fiona drivert használva:
GeoDataFrames és GeoDataSeries#
type(world_borders)
geopandas.geodataframe.GeoDataFrame
world_borders.head()
| FIPS | ISO2 | ISO3 | UN | NAME | AREA | POP2005 | REGION | SUBREGION | LON | LAT | Density | geometry | |
|---|---|---|---|---|---|---|---|---|---|---|---|---|---|
| 0 | AC | AG | ATG | 28 | Antigua and Barbuda | 550 | 83039 | 19 | 29 | -61.783 | 17.078 | 151 | MULTIPOLYGON (((-61.68667 17.02444, -61.73806 ... |
| 1 | AG | DZ | DZA | 12 | Algeria | 2334790 | 32854159 | 2 | 15 | 2.632 | 28.163 | 14 | POLYGON ((2.96361 36.80222, 2.98139 36.80694, ... |
| 2 | AJ | AZ | AZE | 31 | Azerbaijan | 86147 | 8352021 | 142 | 145 | 47.395 | 40.430 | 97 | MULTIPOLYGON (((45.08332 39.76804, 45.26639 39... |
| 3 | AL | AL | ALB | 8 | Albania | 28729 | 3153731 | 150 | 39 | 20.068 | 41.143 | 110 | POLYGON ((19.43621 41.02107, 19.45055 41.06000... |
| 4 | AM | AM | ARM | 51 | Armenia | 29774 | 3017661 | 142 | 145 | 44.563 | 40.534 | 101 | MULTIPOLYGON (((45.57305 40.63249, 45.52888 40... |
type(world_borders)
geopandas.geodataframe.GeoDataFrame
world_borders.crs
<Geographic 2D CRS: EPSG:4326>
Name: WGS 84
Axis Info [ellipsoidal]:
- Lat[north]: Geodetic latitude (degree)
- Lon[east]: Geodetic longitude (degree)
Area of Use:
- name: World.
- bounds: (-180.0, -90.0, 180.0, 90.0)
Datum: World Geodetic System 1984 ensemble
- Ellipsoid: WGS 84
- Prime Meridian: Greenwich
world_borders.columns
Index(['FIPS', 'ISO2', 'ISO3', 'UN', 'NAME', 'AREA', 'POP2005', 'REGION',
       'SUBREGION', 'LON', 'LAT', 'Density', 'geometry'],
      dtype='object')
print(type(world_borders.iloc[:, 12]))
print(type(world_borders.geometry))
<class 'geopandas.geoseries.GeoSeries'>
<class 'geopandas.geoseries.GeoSeries'>
country_names = list(world_borders["NAME"])
print("Hungary" in country_names)
print("Holy Roman Empire" in country_names)
True
False
hungary_df = world_borders[world_borders["NAME"] == "Hungary"]
hungary_shp = hungary_df.geometry.iloc[0]
type(hungary_shp)
shapely.geometry.polygon.Polygon
hungary_shp

Egyszerű vizualizáció#
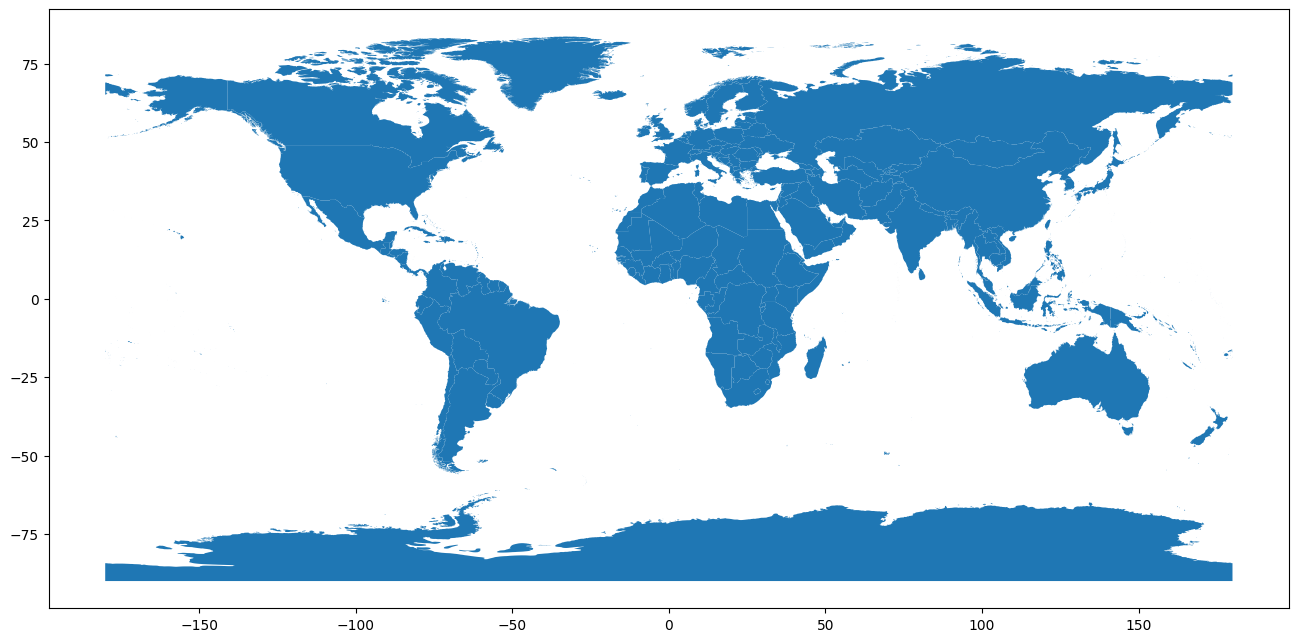
world_borders.plot(figsize=(16, 9))
<Axes: >
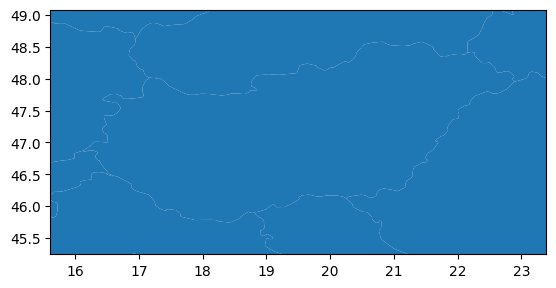
minx, miny, maxx, maxy = hungary_df.total_bounds

ax = world_borders.plot()
ax.set_xlim(minx-0.5, maxx+0.5)
ax.set_ylim(miny-0.5, maxy+0.5)
(45.248329, 49.07666)
def zoom_to_hun(ax, buffer=0.5):
  minx, miny, maxx, maxy = hungary_df.total_bounds
  ax.set_xlim(minx-buffer, maxx+buffer)
  ax.set_ylim(miny-buffer, maxy+buffer)
ax = world_borders.plot()
zoom_to_hun(ax)
Leíró adatok#
Olvassunk ki leíró adatokat az országokról a korábban bemutatott elem azonosítás opcióval. Nézzük meg mennyi volt Görögország népessége 2005-ben?
world_borders.columns
Index(['FIPS', 'ISO2', 'ISO3', 'UN', 'NAME', 'AREA', 'POP2005', 'REGION',
       'SUBREGION', 'LON', 'LAT', 'Density', 'geometry'],
      dtype='object')
# POP2005
world_borders[world_borders['NAME'] == "Greece"]["POP2005"]
73    11099737
Name: POP2005, dtype: int64
Rendezzük az országokat terület szerint növekvő sorrendbe.
world_borders.sort_values(by=['AREA']).head()
| FIPS | ISO2 | ISO3 | UN | NAME | AREA | POP2005 | REGION | SUBREGION | LON | LAT | Density | geometry | |
|---|---|---|---|---|---|---|---|---|---|---|---|---|---|
| 238 | VT | VA | VAT | 336 | Holy See (Vatican City) | 1 | 783 | 150 | 39 | 12.451 | 41.904 | 783 | POLYGON ((12.44509 41.90312, 12.45165 41.90799... |
| 136 | MC | MO | MAC | 446 | Macau | 7 | 47309 | 142 | 30 | 113.545 | 22.200 | 6758 | POLYGON ((113.53166 22.19474, 113.53137 22.201... |
| 133 | GI | GI | GIB | 292 | Gibraltar | 8 | 291 | 150 | 39 | -5.345 | 36.138 | 36 | POLYGON ((-5.33451 36.16256, -5.33755 36.14944... |
| 137 | MN | MC | MCO | 492 | Monaco | 13 | 325 | 150 | 155 | 7.412 | 43.750 | 25 | POLYGON ((7.43929 43.75752, 7.42305 43.74000, ... |
| 196 | TL | TK | TKL | 772 | Tokelau | 21 | 1401 | 9 | 61 | -171.853 | -9.193 | 67 | MULTIPOLYGON (((-171.21472 -9.37750, -171.2191... |
print(list(world_borders.sort_values(by=['AREA'])["NAME"]))
['Holy See (Vatican City)', 'Macau', 'Gibraltar', 'Monaco', 'Tokelau', 'Cocos (Keeling) Islands', 'Nauru', 'Bermuda', 'United States Minor Outlying Islands', 'Norfolk Island', 'Tuvalu', 'Pitcairn Islands', 'Saint Barthelemy', 'Saint Martin', 'Bouvet Island', 'San Marino', 'Guernsey', 'Anguilla', 'British Indian Ocean Territory', 'Montserrat', 'Jersey', 'Christmas Island', 'Marshall Islands', 'Maldives', 'British Virgin Islands', 'Wallis and Futuna Islands', 'Liechtenstein', 'Aruba', 'American Samoa', 'Cook Islands', 'Niue', 'Saint Pierre and Miquelon', 'Saint Kitts and Nevis', 'Cayman Islands', 'United States Virgin Islands', 'Malta', 'Saint Vincent and the Grenadines', 'Heard Island and McDonald Islands', 'Saint Helena', 'Grenada', 'Turks and Caicos Islands', 'Barbados', 'Mayotte', 'Andorra', 'Palau', 'Seychelles', 'Antigua and Barbuda', 'Singapore', 'Guam', 'Isle of Man', 'Northern Mariana Islands', 'Saint Lucia', 'Bahrain', 'Dominica', 'Micronesia, Federated States of', 'Tonga', 'Åland Islands', 'Netherlands Antilles', 'Hong Kong', 'Sao Tome and Principe', 'Martinique', 'Kiribati', 'Faroe Islands', 'Guadeloupe', 'Comoros', 'Mauritius', 'Luxembourg', 'Reunion', 'Samoa', 'French Polynesia', 'Cape Verde', 'South Georgia South Sandwich Islands', 'Trinidad and Tobago', 'Brunei Darussalam', 'Palestine', 'French Southern and Antarctic Lands', 'Cyprus', 'Puerto Rico', 'Lebanon', 'Gambia', 'Jamaica', 'Qatar', 'Falkland Islands (Malvinas)', 'Vanuatu', 'Bahamas', 'Montenegro', 'Timor-Leste', 'Kuwait', 'Swaziland', 'New Caledonia', 'Fiji', 'Slovenia', 'El Salvador', 'Israel', 'Djibouti', 'Belize', 'Rwanda', 'The former Yugoslav Republic of Macedonia', 'Equatorial Guinea', 'Burundi', 'Haiti', 'Solomon Islands', 'Albania', 'Armenia', 'Belgium', 'Lesotho', 'Republic of Moldova', 'Guinea-Bissau', 'Netherlands', 'Taiwan', 'Bhutan', 'Switzerland', 'Denmark', 'Estonia', 'Slovakia', 'Dominican Republic', 'Bosnia and Herzegovina', 'Costa Rica', 'Croatia', 'Togo', 'Svalbard', 'Latvia', 'Lithuania', 'Sri Lanka', 'Ireland', 'Georgia', 'United Arab Emirates', 'Sierra Leone', 'Panama', 'Czech Republic', 'Austria', 'French Guiana', 'Azerbaijan', 'Serbia', 'Jordan', 'Portugal', 'Hungary', 'Liberia', 'Korea, Republic of', 'Iceland', 'Guatemala', 'Cuba', 'Bulgaria', 'Honduras', 'Benin', 'Malawi', 'Eritrea', "Korea, Democratic People's Republic of", 'Nicaragua', 'Greece', 'Bangladesh', 'Tajikistan', 'Suriname', 'Nepal', 'Tunisia', 'Uruguay', 'Cambodia', 'Syrian Arab Republic', 'Senegal', 'Kyrgyzstan', 'Belarus', 'Guyana', "Lao People's Democratic Republic", 'Romania', 'Ghana', 'United Kingdom', 'Uganda', 'Guinea', 'Ecuador', 'Gabon', 'New Zealand', 'Western Sahara', 'Burkina Faso', 'Philippines', 'Italy', 'Poland', 'Oman', 'Norway', "Cote d'Ivoire", 'Viet Nam', 'Finland', 'Malaysia', 'Congo', 'Germany', 'Japan', 'Zimbabwe', 'Paraguay', 'Morocco', 'Yemen', 'Iraq', 'Sweden', 'Uzbekistan', 'Papua New Guinea', 'Cameroon', 'Turkmenistan', 'Spain', 'Thailand', 'France', 'Botswana', 'Kenya', 'Ukraine', 'Madagascar', 'Central African Republic', 'Somalia', 'Afghanistan', 'Burma', 'Chile', 'Zambia', 'Turkey', 'Mozambique', 'Namibia', 'Pakistan', 'Nigeria', 'Venezuela', 'United Republic of Tanzania', 'Egypt', 'Mauritania', 'Bolivia', 'Ethiopia', 'Colombia', 'Niger', 'South Africa', 'Angola', 'Mali', 'Chad', 'Peru', 'Mongolia', 'Libyan Arab Jamahiriya', 'Iran (Islamic Republic of)', 'Indonesia', 'Saudi Arabia', 'Mexico', 'Greenland', 'Algeria', 'Democratic Republic of the Congo', 'Sudan', 'Kazakhstan', 'Argentina', 'India', 'Australia', 'Brazil', 'China', 'United States', 'Canada', 'Antarctica', 'Russia']
Új attribútum mező levezetése: Az egyes országok népsűrűséget akár, mint leíró adatot is kiszámíhatjuk.
world_borders['density'] = world_borders['POP2005'] / world_borders['AREA']
Olvassuk ki várhatóan hány fő tartózkodott egy négyzetkilométeren Magyarországon 2005-ben?
world_borders[world_borders["NAME"] == "Hungary"]['density']
80    108.578363
Name: density, dtype: float64
Bonyolultabb vizualizáció a világtérképen#
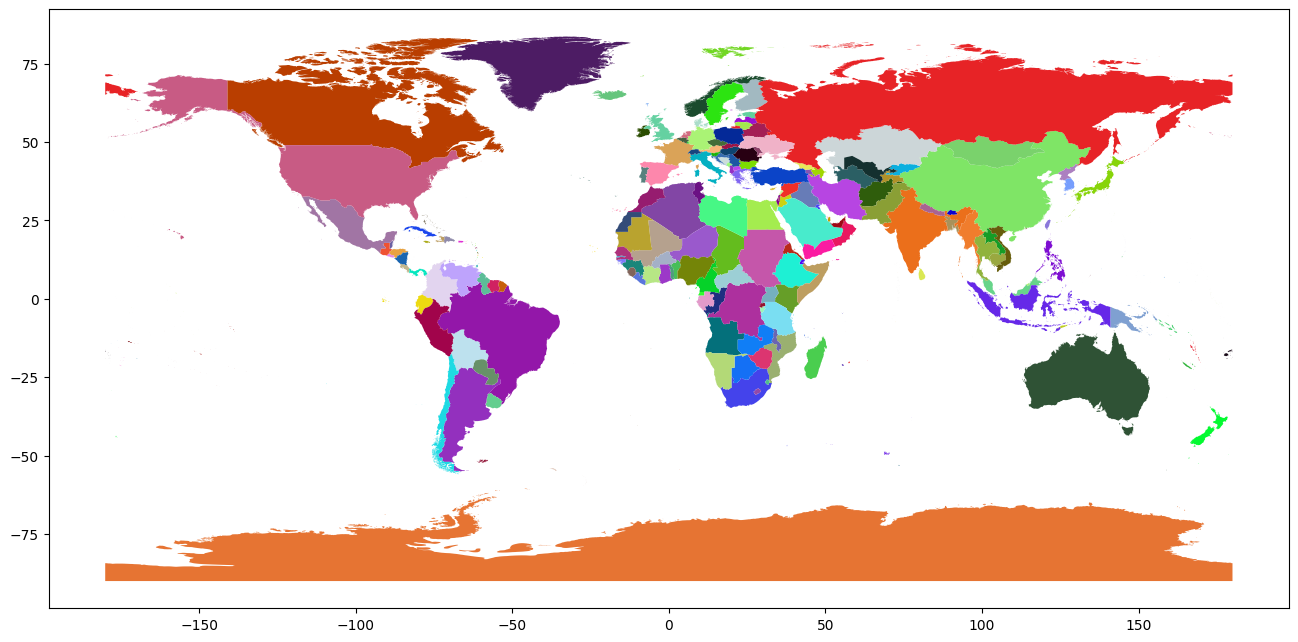
Színezzük véletlenszerűen az országokat!
from matplotlib.colors import to_rgba
import numpy as np

# convert 3 random 0-1 number to color
to_rgba(np.random.rand(3))
(0.8565331355374871, 0.33818754651776584, 0.5195208069090216, 1)
country_colors = [to_rgba(np.random.rand(3)) for i in range(len(world_borders))]
world_borders['color'] = country_colors
world_borders.plot(color=world_borders['color'], figsize=(16, 9))
<Axes: >
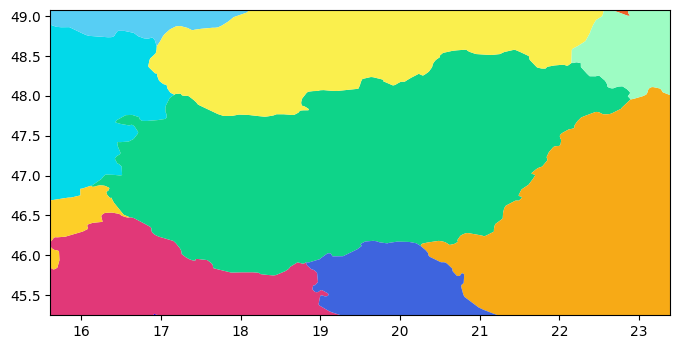
world_borders['color'] = world_borders.apply(lambda row: to_rgba(np.random.rand(3)), axis=1)
ax = world_borders.plot(color = world_borders['color'], figsize=(8, 4))
zoom_to_hun(ax)
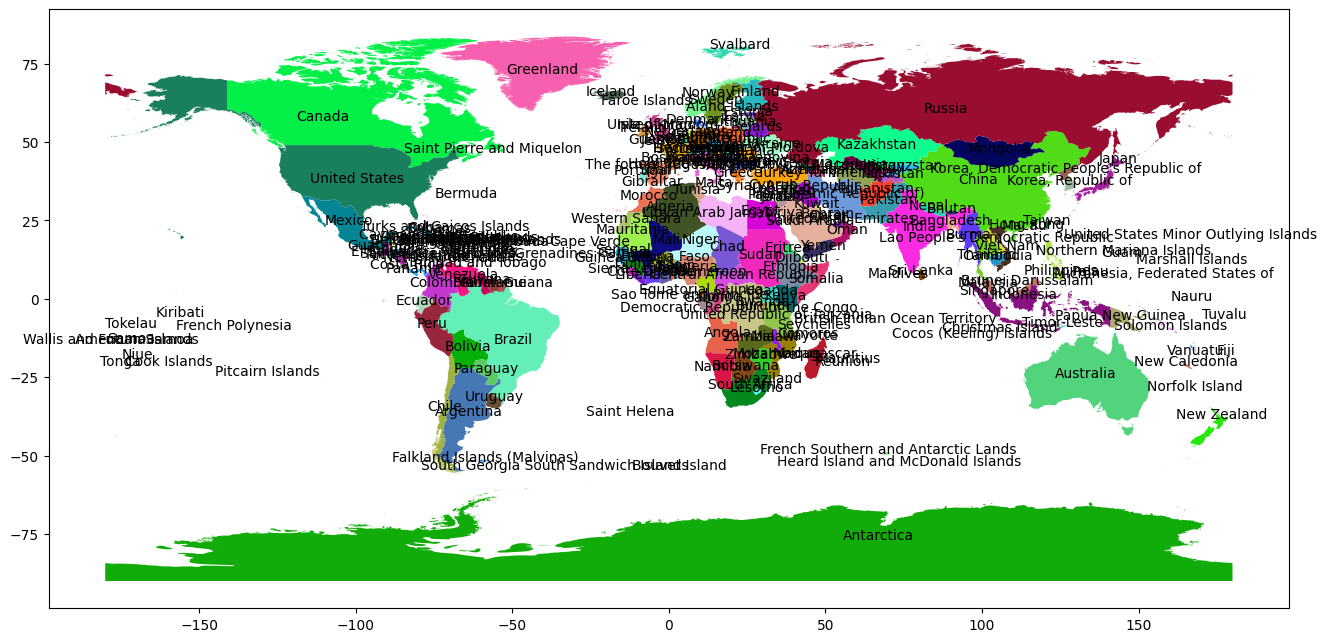
Feliratozzuk az országok a neveikkel:
world_borders['anchor'] = world_borders['geometry'].apply(lambda x: x.representative_point().coords[:])
world_borders['anchor'] = [coords[0] for coords in world_borders['anchor']]
ax = world_borders.plot(color=world_borders['color'], figsize=(16, 9))
#zoom_to_hun(ax)
for idx, row in world_borders.iterrows():
    ax.annotate(text=row['NAME'], xy=row['anchor'], horizontalalignment='center')
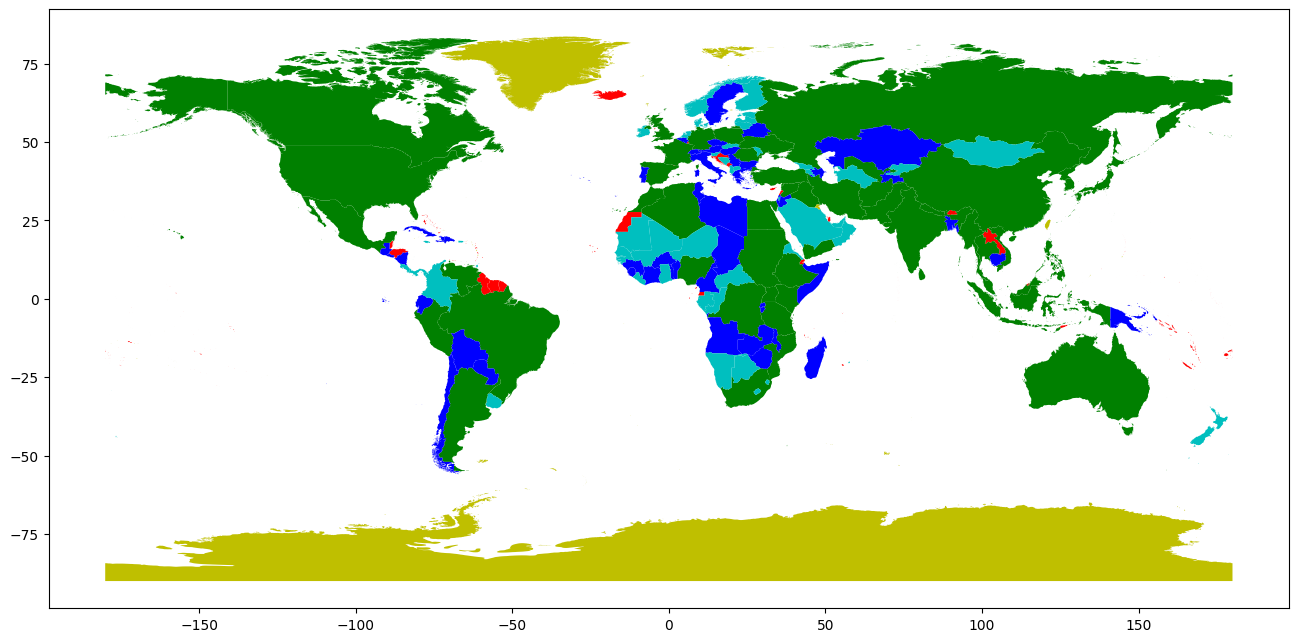
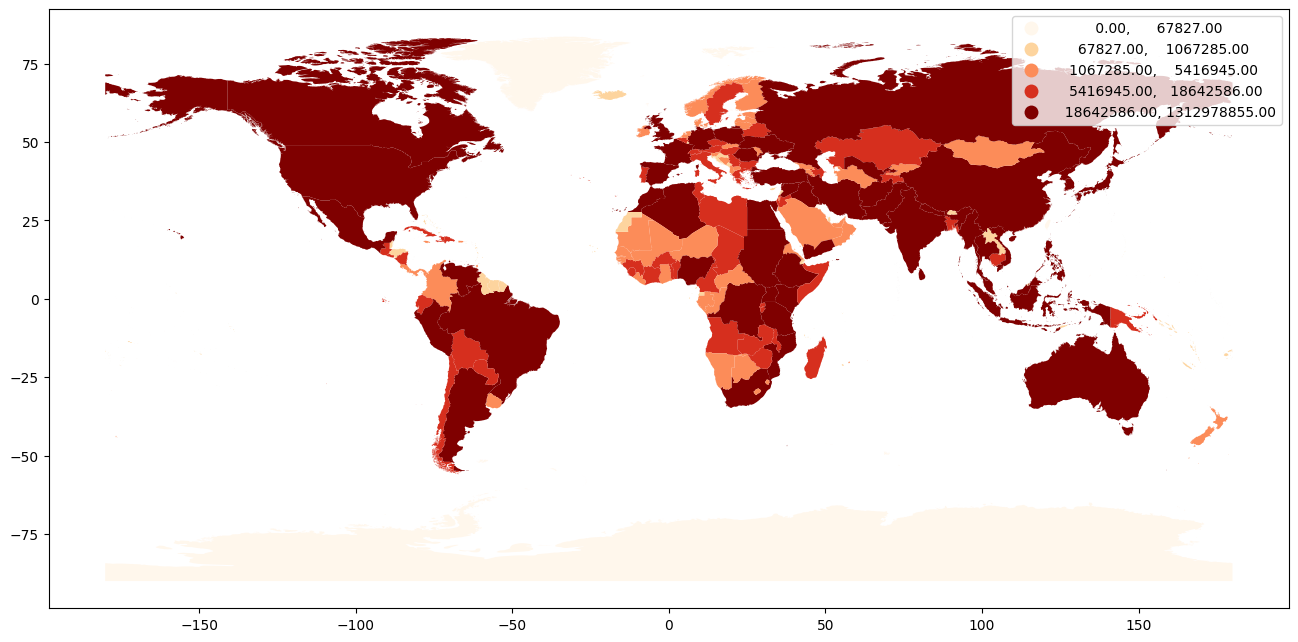
Jelenítsük meg az országokat népességük alapján 5 egyenlő számosságú osztályba sorolva.
import pandas as pd
#cats = pd.cut(world_borders.POP2005, 5) # bins with equal length not equal sized bins
categories_column, bins = pd.qcut(world_borders.POP2005, 5, retbins=True, duplicates='drop')
categories_column
0            (67827.0, 1067285.0]
1      (18642586.0, 1312978855.0]
2         (5416945.0, 18642586.0]
3          (1067285.0, 5416945.0]
4          (1067285.0, 5416945.0]
                  ...
241             (-0.001, 67827.0]
242             (-0.001, 67827.0]
243             (-0.001, 67827.0]
244             (-0.001, 67827.0]
245             (-0.001, 67827.0]
Name: POP2005, Length: 246, dtype: category
Categories (5, interval[float64, right]): [(-0.001, 67827.0] < (67827.0, 1067285.0] < (1067285.0, 5416945.0] < (5416945.0, 18642586.0] < (18642586.0, 1312978855.0]]
pop_categories = categories_column.unique()
world_borders[categories_column == pop_categories[0]].head()
| FIPS | ISO2 | ISO3 | UN | NAME | AREA | POP2005 | REGION | SUBREGION | LON | LAT | Density | geometry | density | color | anchor | |
|---|---|---|---|---|---|---|---|---|---|---|---|---|---|---|---|---|
| 0 | AC | AG | ATG | 28 | Antigua and Barbuda | 550 | 83039 | 19 | 29 | -61.783 | 17.078 | 151 | MULTIPOLYGON (((-61.68667 17.02444, -61.73806 ... | 150.980000 | (0.7648307016753471, 0.4730119391606151, 0.138... | (-61.77846144624214, 17.06541450000003) |
| 9 | BA | BH | BHR | 48 | Bahrain | 657 | 724788 | 142 | 145 | 50.562 | 26.019 | 1103 | MULTIPOLYGON (((50.81249 25.64222, 50.79250 25... | 1103.178082 | (0.7355258675625339, 0.09347767964709497, 0.84... | (50.55007111604336, 26.018053000000066) |
| 10 | BB | BB | BRB | 52 | Barbados | 454 | 291933 | 19 | 29 | -59.559 | 13.153 | 643 | POLYGON ((-59.53306 13.05055, -59.54333 13.067... | 643.024229 | (0.770941770034137, 0.5988919012585697, 0.2234... | (-59.57258683669045, 13.197222) |
| 12 | BF | BS | BHS | 44 | Bahamas | 12928 | 323295 | 19 | 29 | -78.014 | 24.628 | 25 | MULTIPOLYGON (((-73.03723 21.13944, -73.12361 ... | 25.007348 | (0.7084290710221417, 0.399250649256238, 0.7439... | (-73.33565591585821, 21.11791400000004) |
| 14 | BH | BZ | BLZ | 84 | Belize | 22391 | 275546 | 19 | 13 | -88.602 | 17.219 | 12 | MULTIPOLYGON (((-87.80334 17.29417, -87.80917 ... | 12.306105 | (0.6348994159216638, 0.8733963843075591, 0.198... | (-88.7216096567985, 17.213470500000057) |
print(len(world_borders) / 5)
print(len(world_borders[categories_column == pop_categories[0]]))
print(len(world_borders[categories_column == pop_categories[4]]))
49.2
49
50
ax = world_borders[categories_column == pop_categories[0]].plot(color='r', figsize=(16, 9))
world_borders[categories_column == pop_categories[1]].plot(ax=ax, color='g')
world_borders[categories_column == pop_categories[2]].plot(ax=ax, color='b')
world_borders[categories_column == pop_categories[3]].plot(ax=ax, color='c')
world_borders[categories_column == pop_categories[4]].plot(ax=ax, color='y')
<Axes: >
Vagy használhajtuk a mapclassify csomagot, amit viszont telepíteni kell. További információkat itt és további példákat itt lehet találni a csomag használatáról.
!pip install mapclassify
Requirement already satisfied: mapclassify in /home/zoltan/env/uni/lib/python3.8/site-packages (2.5.0)
Requirement already satisfied: pandas>=1.0 in /home/zoltan/env/uni/lib/python3.8/site-packages (from mapclassify) (2.0.2)
Requirement already satisfied: scikit-learn in /home/zoltan/env/uni/lib/python3.8/site-packages (from mapclassify) (1.2.2)
Requirement already satisfied: scipy>=1.0 in /home/zoltan/env/uni/lib/python3.8/site-packages (from mapclassify) (1.10.1)
Requirement already satisfied: numpy>=1.3 in /home/zoltan/env/uni/lib/python3.8/site-packages (from mapclassify) (1.24.3)
Requirement already satisfied: networkx in /home/zoltan/env/uni/lib/python3.8/site-packages (from mapclassify) (3.1)
Requirement already satisfied: python-dateutil>=2.8.2 in /home/zoltan/env/uni/lib/python3.8/site-packages (from pandas>=1.0->mapclassify) (2.8.2)
Requirement already satisfied: pytz>=2020.1 in /home/zoltan/env/uni/lib/python3.8/site-packages (from pandas>=1.0->mapclassify) (2023.3)
Requirement already satisfied: tzdata>=2022.1 in /home/zoltan/env/uni/lib/python3.8/site-packages (from pandas>=1.0->mapclassify) (2023.3)
Requirement already satisfied: threadpoolctl>=2.0.0 in /home/zoltan/env/uni/lib/python3.8/site-packages (from scikit-learn->mapclassify) (3.1.0)
Requirement already satisfied: joblib>=1.1.1 in /home/zoltan/env/uni/lib/python3.8/site-packages (from scikit-learn->mapclassify) (1.2.0)
Requirement already satisfied: six>=1.5 in /home/zoltan/env/uni/lib/python3.8/site-packages (from python-dateutil>=2.8.2->pandas>=1.0->mapclassify) (1.16.0)
world_borders.plot(column='POP2005', cmap='OrRd', scheme='quantiles', k=5, figsize=(16, 9), legend=True)
<Axes: >
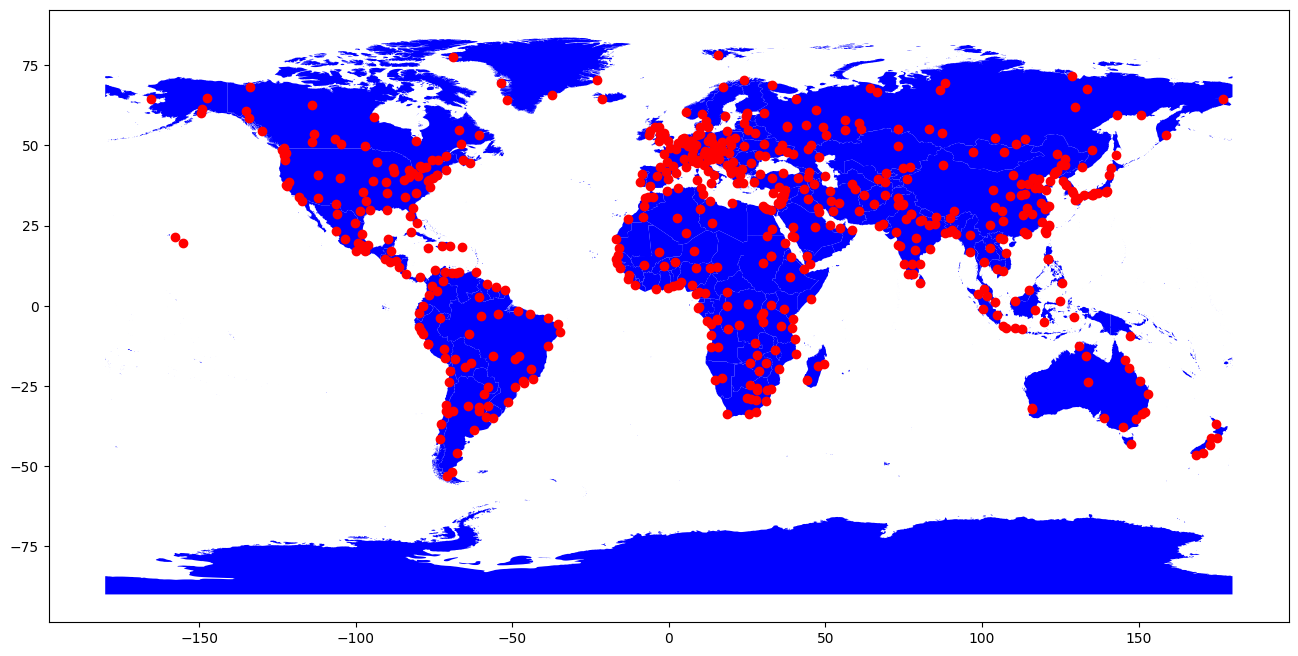
Viágvárosok adat#
Töltsük be a Világvárosok vektor réteget, és címkézzük meg a réteg elemeit a városok neveivel. Ezt követően jelenítsük meg csak a fővárosokat:
world_cities = geopandas.read_file("data/geo_viz/cities.shp")
world_cities.columns
Index(['NAME', 'COUNTRY', 'POPULATION', 'CAPITAL', 'geometry'], dtype='object')
ax = world_borders.plot(color='b', figsize=(16, 9))
world_cities.plot(ax=ax, color='r')
<Axes: >
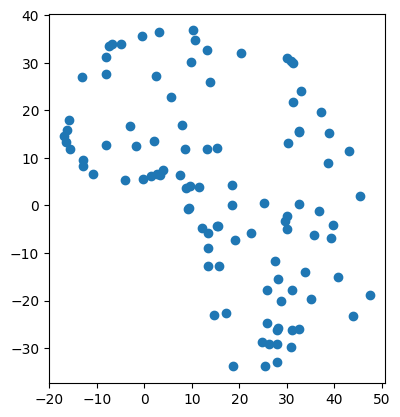
Térbeli lekérdezés: contains és within#
world_borders["REGION"].unique()
array([ 19, 2, 142, 150, 9, 0])
world_borders[world_borders["REGION"] == 2].geometry.unary_union

africa_df = world_borders[world_borders["REGION"] == 2]
africa_shp = africa_df.unary_union
cities_in_africa = world_cities[world_cities.within(africa_shp)]
cities_in_africa.plot()
<Axes: >
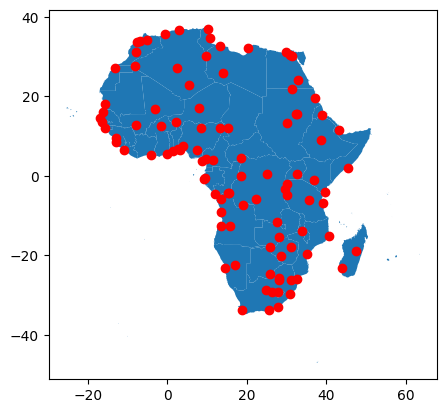
ax = africa_df.plot()
cities_in_africa.plot(ax=ax, c='r')
<Axes: >
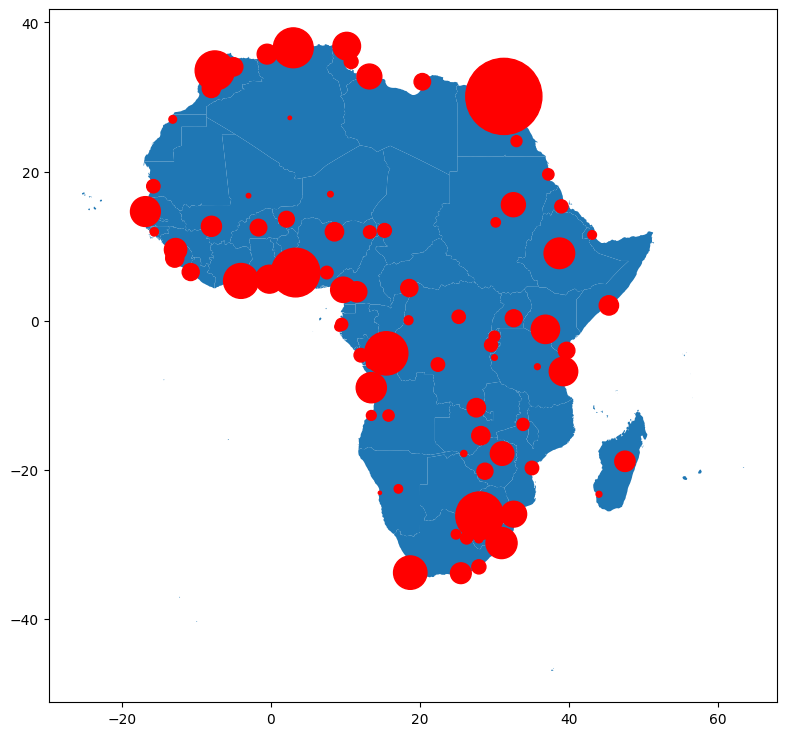
ax = africa_df.plot(figsize=(16,9))
max_val = cities_in_africa['POPULATION'].max()
marker_size = cities_in_africa['POPULATION']/max_val*3000
cities_in_africa.plot(ax=ax, c='r', markersize=marker_size)
/home/zoltan/env/uni/lib/python3.8/site-packages/matplotlib/collections.py:963: RuntimeWarning: invalid value encountered in sqrt
  scale = np.sqrt(self._sizes) * dpi / 72.0 * self._factor
<Axes: >
Térbeli lekérdezés: buffer#
hungary_shp
hungary_shp.buffer(0.5)

hungary_df.crs
<Geographic 2D CRS: EPSG:4326>
Name: WGS 84
Axis Info [ellipsoidal]:
- Lat[north]: Geodetic latitude (degree)
- Lon[east]: Geodetic longitude (degree)
Area of Use:
- name: World.
- bounds: (-180.0, -90.0, 180.0, 90.0)
Datum: World Geodetic System 1984 ensemble
- Ellipsoid: WGS 84
- Prime Meridian: Greenwich
print(world_borders.loc[56]["NAME"])

hungary_shp.buffer(0.5).intersects(world_borders.loc[56].geometry)
Austria
True
# Using shapely intersects
idx_df = world_borders.geometry.apply(lambda g: hungary_shp.buffer(0.5).intersects(g))
hungary_neihgbors = world_borders[idx_df]
hungary_neihgbors["NAME"]
56      Austria
79      Croatia
80      Hungary
104    Slovakia
170     Romania
183    Slovenia
207     Ukraine
237      Serbia
Name: NAME, dtype: object
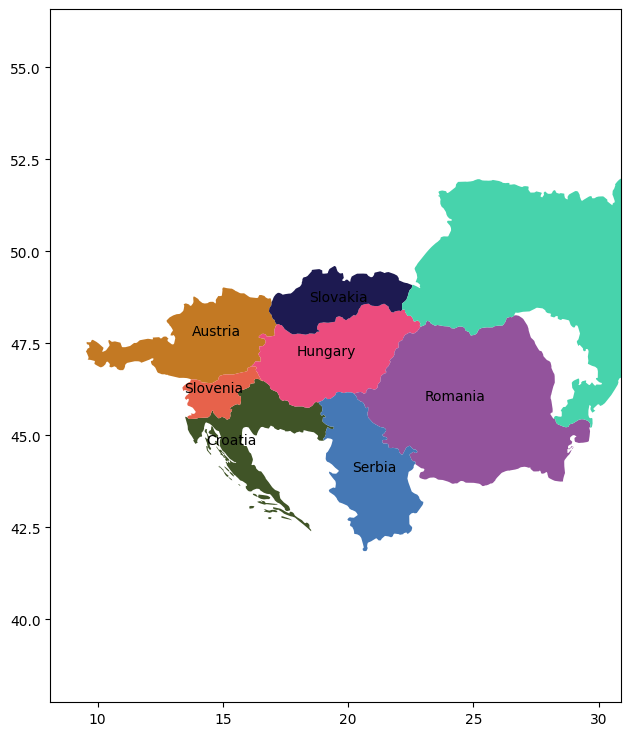
ax = hungary_neihgbors.plot(color=world_borders['color'], figsize=(16, 9))
zoom_to_hun(ax, 8.0)
for idx, row in hungary_neihgbors.iterrows():
    plt.annotate(text=row['NAME'], xy=row['anchor'], horizontalalignment='center')